The EPRO Report Designer is an extensive tool which allows users to build and customize reports. Reports can be built around a company’s analytic needs, outputting customized reports to provide useful information to review and assess data relevant to you and your organization. Any report that already exists can also be changed and modified to meet custom needs, all done inside EPRO Analytics.
Open the Report Designer
-
Open EPRO Analytics from the header bar of the application by clicking on the launch button.
-
Select a preset report you wish to modify or if you desire to make a new report completely, select a report preset that most directly relates to the type of report desired.
-
Run the report with "Preview" set as output.
-
Click the Report Designer button. A new window will appear.
Note
Depending on your Organization's user configuration, some users may be able to directly access a blank report through the “Designer” button located in the top right quadrant.
Report Elements
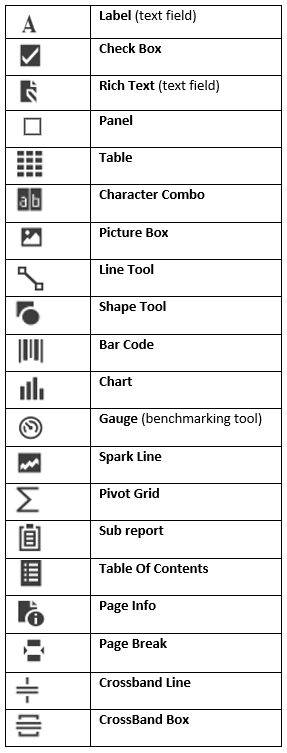
Page Elements
Design a report by dragging and dropping any of the elements below onto the design grid.
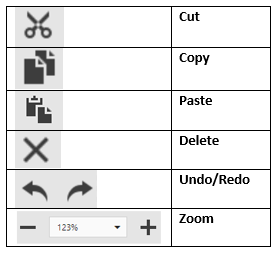
Page Control Elements
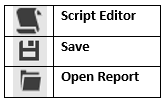
Report Elements
Save a Report
Use the File > Save/Save As option to save a report.

Share a Custom Report from Designer
To share a report with other users, click on File > Save As > Public > Select user access level. This will allow users in the selected role to access the report.
Delete a Report
To delete a report, select File > Delete.
Access a Custom Report
To open a custom report, click EPRO Analytics > Custom Reports.
Create a New Report from Designer
To start creating a new report from scratch, select File > New from the menu bar.
Open an Existing Report in the Designer
To open an existing report, select File > Open from the menu bar.
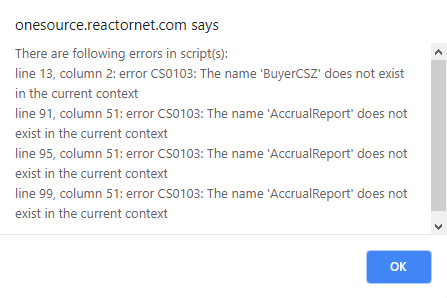
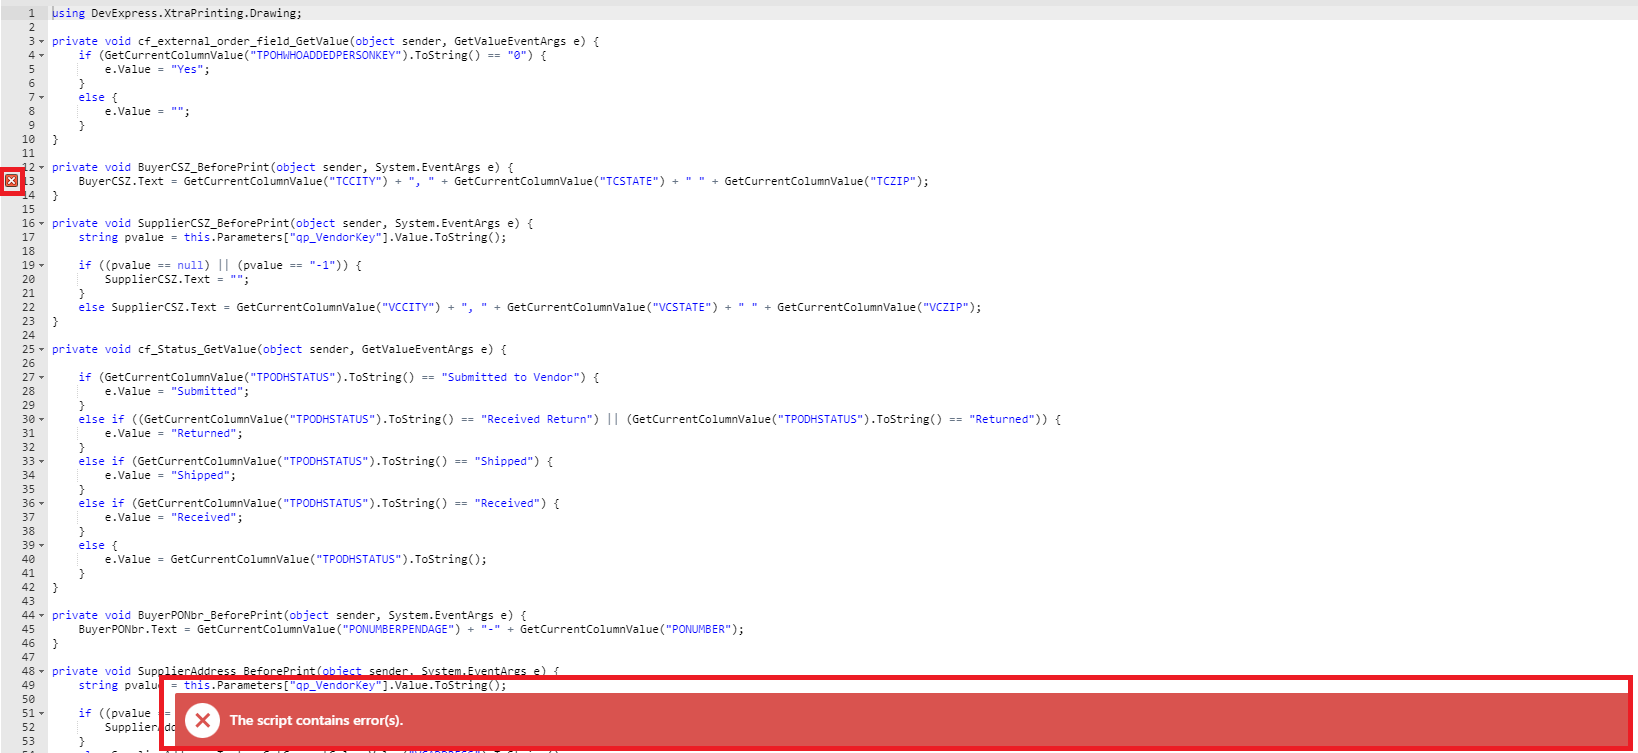
Script Correction
Whenever making major changes to a report some areas in the script may become void and needs corrected. Whenever a script error occurs, a message similar to the one below will display.
-
Open the Designer.
-
Click on the Script Icon.
-
Click the "Validate" Checkmark.

-
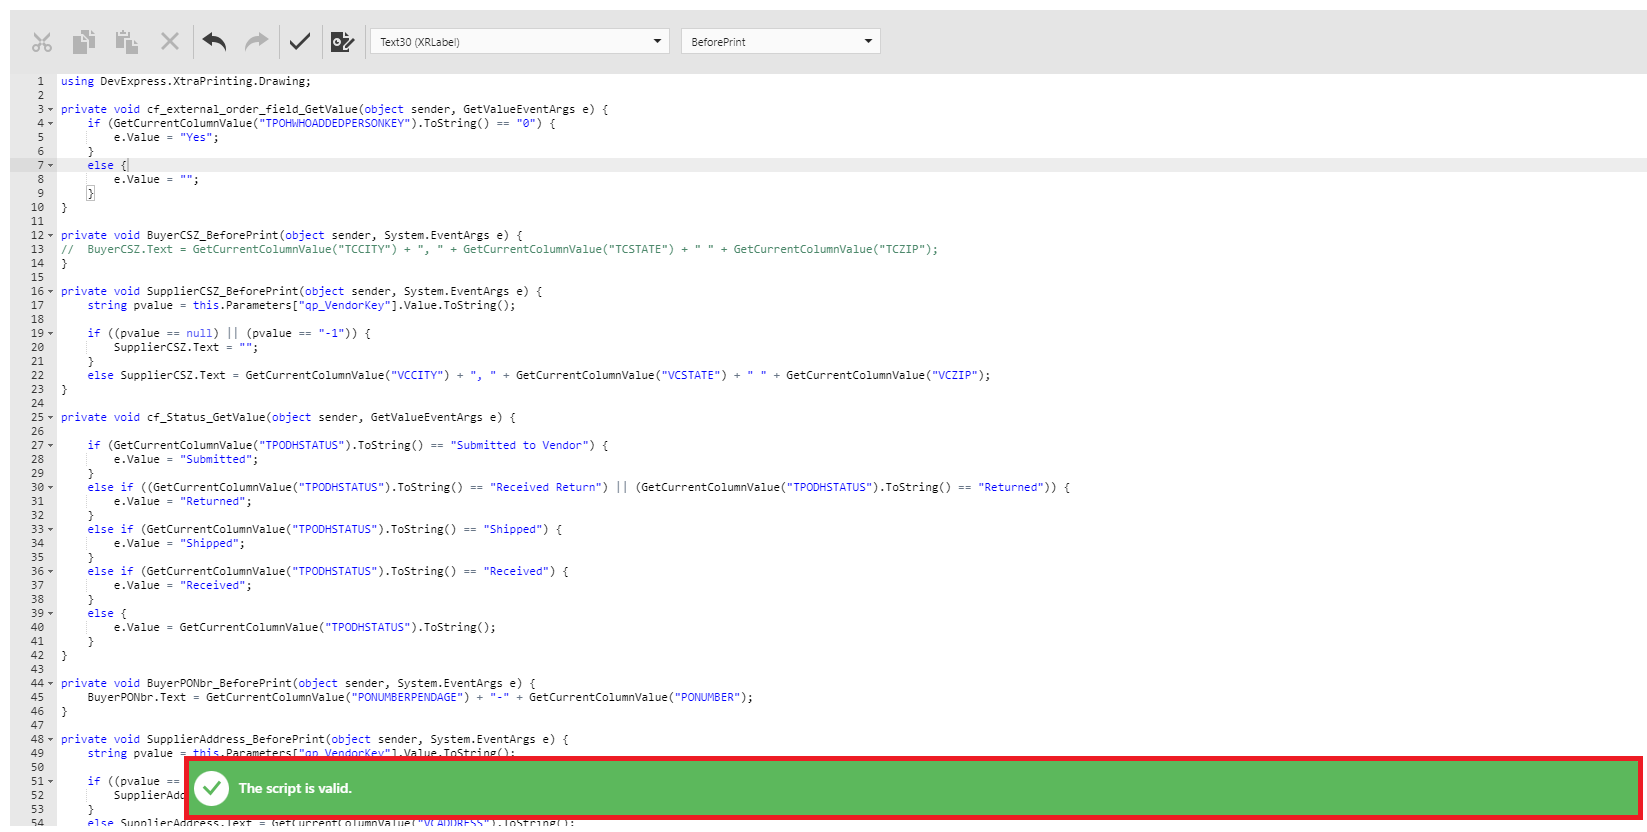
Find any lines with a red X.
-
Make these lines a comment by adding "//" infront of the first character on the line, or delete the line entirely.

-
Click the "Validate Checkmark. A message should appear claiming the script is valid. If not, continue correcting errors.
-
Click the designer icon to save and return to the designer. If you plan on making no further changes, save the report.
Styles
Styles allow report elements to be visually customized.
Add/Manage Styles
-
To access a style navigate to an element you would like to stylize, then click “Styles”.
-
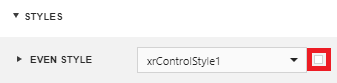
In this menu you can choose from doing an Even Style, an Odd Style, or a Style not associated with either. From here you can either create a new style, or edit an existing one.
Note
-
Any changes made to any style will be applied to all elements using that style.
-
All Styles are limited to the report it was made on.
Remove a Style
Note
Styles cannot be deleted, only unapplied.
-
Navigate to an Element with a style you wish to remove > Click on the white box next to the style name > Reset.
Alternative access to an Existing Style
-
If a style is already in use, navigate to Properties > xrControlStyle(#).
Reset
-
Navigate to an Element with something you would wish to restore to default > Click on the white box next to the style name > Reset.
Borders
-
Change Color/Transparency - Click on element > Appearance > Border Color.
-
Change Dash Style - Click on element > Appearance > Border Dash Style.
-
Change Width - Click on element > Appearance > Border Width.
-
Change border Location on Element - Click on element > Appearance > Borders > Click on any desired layout.
XtraReport
Access XtraReport
Properties > Report# (XtraReport)
Add a Watermark
XtraReport > Appearance > Watermark
Change Report Orientation
XtraReport > Page Settings > Landscape (On/Off)
Change Measuring Unit
XtraReport >Behavior > Measure Units
Change Report Name
XtraReport > Design > Name
Create a Sub-Report
XRSubreport (Left side) > Drag onto report > Double click
Element Manipulation:
Elements can be manipulated to change sizes based on the element.
-
To transform an element you can either:
-
Click and Drag the elements boundaries.
-
Layout > Size > Enter Data
-
-
The X and Y locations of an element can also be modified by either:
-
Click and drag from the elements center.
-
Layout Size > Enter Data
-
Managing Multiple Elements in a Report
By clicking and dragging over multiple similar elements, any design changes made will be applied to all selected elements.
Element Behavior Essentials
On any element or multiple elements you can:
-
Behavior Angle – Adjust the angle
-
Grow - Allow the element to grow (Vertical)
Note
Only table growth is compatible with styles.
-
Shrink – Allow the element to shrink (Vertical)
Note
Only table shrinking is compatible with styles.
-
Keep together - Keeps table together over multiple pages
-
Multiline – Text can expand more than 1 line
-
Word Wrap – Text can wrap
Tables
-
Add a table to your report with XRTable.
-
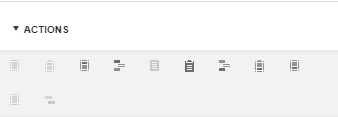
To add, remove, or fit text to cells Actions > Click on desired change.
Note
Selected the table as a whole will allow changes to be made within the entire table.
Bands
Add Bands
-
Action > Click on Desired Band Type.
Remove Bands
-
Select the band you wish to delete. Note: Structural bands such as Margin bands cannot be deleted.
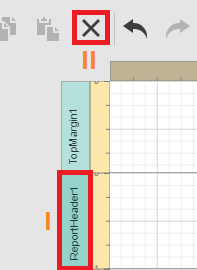
-
Click the black X at the top menu or the Delete key on a standard keyboard.
Expand or Conceal a Band
-
Click on the grey line at the bottom the band you wish to make changes to.
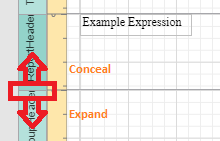
-
Hold the line and drag down to expand, or drag up to conceal.
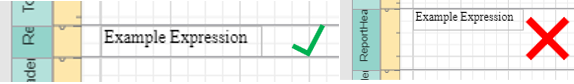
Important
Do not leave a band expanded before running your report. Make sure to conceal your band completely, failing to do so will result is spacing issues inside your report.
Hide/Unhide Bands
-
Double-click on the Band Name in the report to hide, double-click again to show.
Band Types
-
Top Margin Band
-
Report Header Band
-
Page Header Band
-
Group Header Band
-
Detail Band
-
Detail Report Band
-
Group Footer Band
-
Report Footer Band
-
Page Footer Band
-
Bottom Margin Band
-
Sub-Band
Shorten or Widen Margins
-
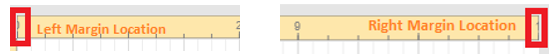
To shorten or widen a margin click on a margin line (left margin marked as 0, right margin unmarked).
-
If no margin is shown, the left margin is on the left most part of the x axis, and the right margin is on the right most.
-
Numerically change Margins
-
Go to Properties > XtraReport > Page Settings > Margins.
-
Enter the desired margins.
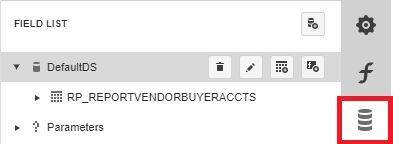
Fields
Access the Field List
-
Navigate to the Data Barrel icon on the right side of the screen.
Add a Data Source
Data Barrel > Add New Data Source
Add a Query
Data Barrel > Data Source > Add Query
Remove Data Source
Data Barrel > Data Source > Remove Data Source
Master Detail Relations
Data Barrel > Data Source > Edit Master Detail Relations
Edit Query
Data Barrel > Data Source > Query > Edit Query
Remove Query
Data Barrel > Data Source > Query > Remove Query
Add Calculated Field
Data Barrel > On Data Source or Query
Add Parameter
Data Barrel > Parameters > Add
Edit Parameter
Data Barrel > Parameters > Select Parameter > Edit
Remove Parameter
Data Barrel > Parameters > Select Parameter > Remove
Parameter Options Definitions
-
Name – parameter name the stored procedure is expecting
-
Description – Name you want users to see if made visible
-
Visible – toggles whether or not the user is able to see this parameter on the report parameters selector
-
Multi-Value – can users select multiple values? (ex. Check boxes)
-
Type – dependent on the data being passed back to the stored procedure
-
Value – dependent on data being passed back. Buyerkey updates with each time the report is run so it should remain blank, however other parameters may need a consistent string to be passed which would need to be set here
-
Look-Up Settings – determine the type of drop down list, if parameter is visible
String Formatting
Click on an element > Text Format String
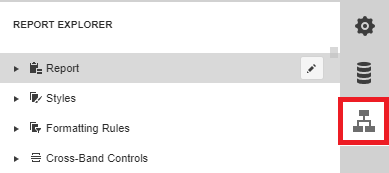
Access Report Explorer
-
Navigate to the Report Explorer on the right side of the screen.
Import Image
-
Select any element or option which allows the addition of images (ex. Picture Box, Watermark).
-
Click on the three dots next to the word Image.
-
Select an image from your files.
Design a chart in a report
On certain elements such as charts you can run a designer on the element.
-
Drag a chart onto the report.
-
Click the Run Designer text in the top right corner.
-
After Designing your chart, click Okay.